

Reference library for digital user experience
An evolving list of free resources with data and insights describing digital user experience. Latest entries at the top of the page. To contribute, please add a comment to this post containing the link, report title, author, a quote and a single sentence summary.
Design Guides
Apple
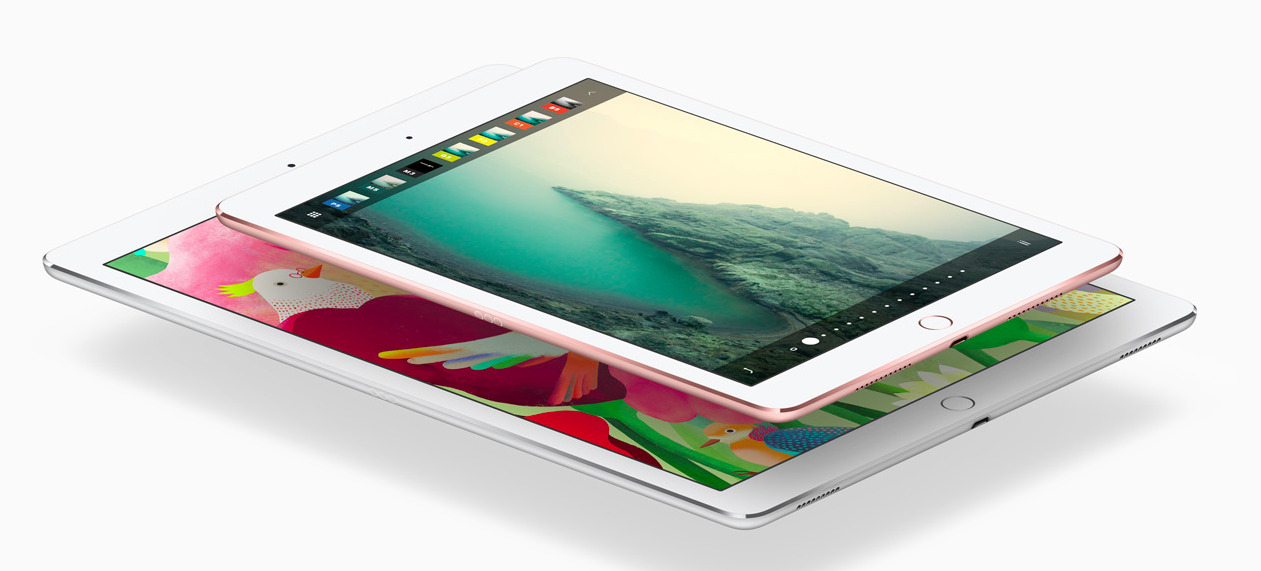
Comprehensive resources, from advice to usable assets, for developing good user experience on iOS, macOS, watchOS and tvOS. While obviously Apple-centric, many of the design principles could equally be applied to other platforms.
2015 Nielsen Music U.S. Report
Nielsen
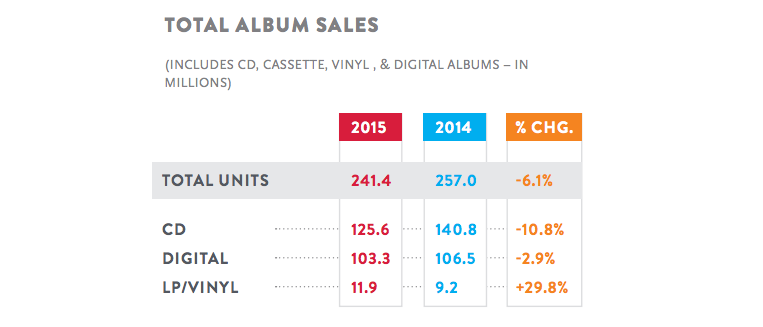
Nielsen’s detailed metrics on how users in America consumed their music in 2015. Includes surprising nuggets which might prompt a rethink on how people really feel about music formats, such as how digital album sales fell 2.9 percent from 2014 to 2015, while vinyl album sales grew 29.8 percent. Requires free registration to access the full report.
Design tools survey
Khoi Vinh (Subtraction.com)
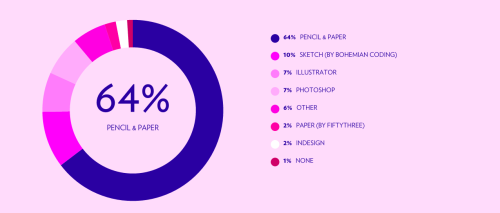
Results of a 4000 participant, 200 country survey asking designers about their methods and preferred tools across a range of categories from brainstorming to interface design.
A locally relevant web (PDF)
Mozilla & GSMA
“My daughter and I, we can’t go on the Internet. It’s like this. It is the same for the others in
this community it is not appropriate for us, but if my brother wants, he can.”
A 9 week, 300+ participant study conducted in Bangladesh, India and Kenya to explore attitudes to digital and connectivity. It focuses on the role of digital devices as content creation tools and went on to inform Mozilla’s open source Webmaker product. The findings range from gender issues to the overall absence of digital literacy.
Interactive guide to choosing prototyping tools
Emily Schwartzman (for Cooper)
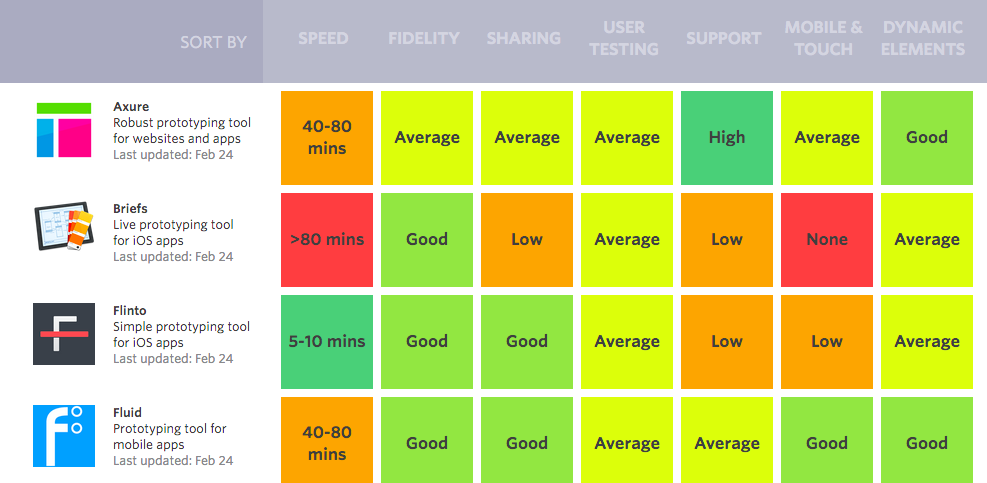
…the vast landscape of modern prototyping tools can be overwhelming…
This ‘living document’ allows you to sort through about 20 (as of August 2015) UX prototyping tools, organising them according to the capabilities most import to you, ranging from the intended device type to the level of fidelity required. Helpful when starting a new project or to expand your knowledge of the tools available.
Curious Rituals: Gestural Interaction in the Digital Everyday (PDF)
Nicolas Nova, Katherine Miyake, Walton Chiu, Nancy Kwon

“The iPad Photographer: The iPad is held in both hands a little awkwardly and at arm’s length until the Camera app focuses on the intended subject, at which point a finger or thumb is bent onto the touch screen in order to attempt to hit the ‘shutter release’ button
This digital book from Nova et al catalogues the often bizarre user behaviours which have become commonplace with the growth of connected devices. It pairs 1950s-style cartoon illustrations with observational insight to explain everything from the ‘meeting room wake up call’ to the ‘wifi dowser’. Essential reading for those seeking to apply a real world lens to innovation.
BuzzCity Quarterly Report
BuzzCity
“Nokia Series 40 phones accounted for 41% of advertisements served in South Africa in Q1 2015, compared with 32% on Android OS”
BuzzCity delivered 87.6 billion banners to mobile devices in Q1 2015 and its advertising network is one of the longest established platforms for marketing to mobile users. Its quarterly reports provide surprising insights into behaviour in developing markets, where usage of platforms such as Nokia Series 40 and Blackberry OS remains commonplace as of 2015. Broken down by country and summarised across the network.
Context cards for dynamic user experience
Haptimap
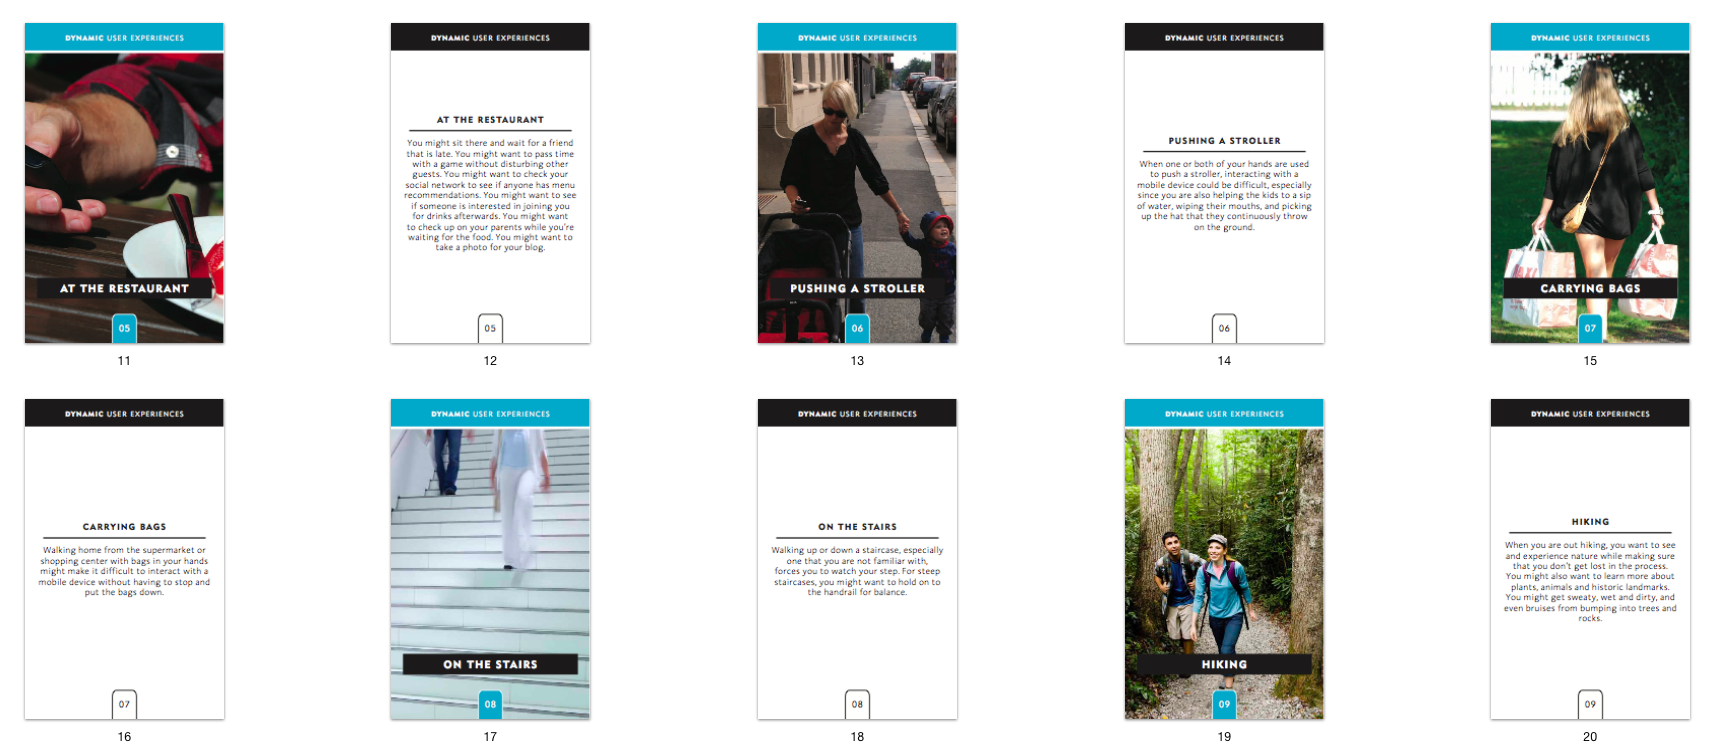
A useful toolkit for designing digital services appropriate to context. Created by the EU-funded Haptimap project, it is published in a variety of freely available and downloadable formats, from a compact deck of printable cards to a full workbook describing the process and strategy. Contextual situations described range from the complications of using digital services while riding a bike to the considerations of digital use when carrying shopping bags.
Smartphone OS sales market share
Kantar World Panel
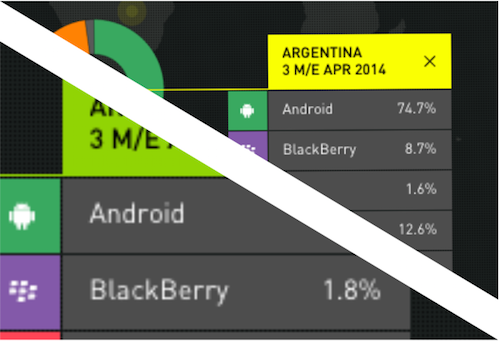
Frequently updated data tracking sales of smartphone OS in several markets around the world. Interactive tool enabling, for instance, country-by-country comparison of sales over a number of years (e.g. in April 2014, Blackberry represented 8.7% market share in Argentina, falling to 1.8% by April 2015).
Ericsson Mobility Report
Ericsson
“Myanmar (population: 53m) added 5 million mobile subscriptions in Q1 2015, compared with 8 million across China (population: 1357m)”
Updated several times a year, the Ericsson Mobility Report provides granular data on mobile subscriptions and network traffic. Includes written analysis, graphs highlighting interesting trends and an interactive tool for modelling your own queries.
TV and media 2014 (PDF)
Ericsson
“Smartphone owners watch an average of 5 hours video on their devices each week: 3 hours at home and 2 hours on the move.”
Summary of a large-scale consumer study into digital media behaviours across a wide range of device classes. Based on 23,000 surveys across 23 countries and supported by additional qualitative user and expert interviews.
Micro-moments
Google
“90% of smartphone users have used their phone to make progress toward a long term goal or multi-step process while out and about.”
How users employ mobile devices to shape decisions throughout numerous small interactions over the course of the average day.
Communications Markets Report
Ofcom
“Spend on content by all UK TV channels in 2013 increased by 3.7% to £5.8bn. The increase was driven by higher spending by sports channels.”
Annual summary of trends across all aspects of the UK’s digital communications, from TV viewing to mobile device usage.
U.S. Smartphone Use in 2015
Pew Research Center
“10% of Americans own a smartphone but do not have any other form of high-speed internet access at home beyond their phone’s data plan.”
Detailed analysis of American smartphone users’ behaviour and overall market statistics.
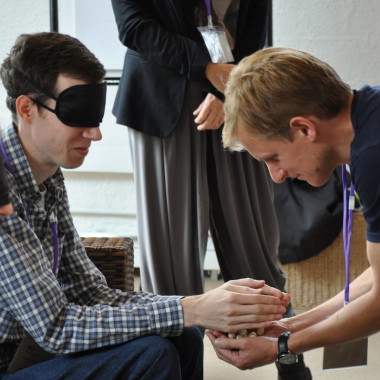
Digitising the Disabled Billion – Accessibility Gets Personal 2015
Lewis Insight / Telefonica
“Disabled people on average earn 62.5% of their able-bodied counterparts. Is there a disabled glass ceiling?”
Worldwide data on disabilities and strategy suggestions for digital technology to improve accessibility.
“Smartphone numbers are predicted to grow at a CAGR of 14.5% from 2014 to 2020”
Annual report across all aspects of mobile communication, with detailed breakdowns of everything from data traffic type to mobile device usage.
Ageing in cities
OECD
“The number of over-65s in urban areas in OECD countries rose by 23.8% over 2001-11”
Insight into the policy implications of ageing societies and the role of technology in urban areas.
The new multi-screen world
Google
“On average we spend 4.4 hours of leisure time in front of our screens each day.”
An early (2012) but extensive study into how U.S. users’ digital lives are expanding across multiple touchpoints, from smartphones to interactive TVs.
+ There are no comments
Add yours