
How does user experience affect performance in the mobile handset industry?
The first quarter of 2008 saw some significant changes to the breakdown of market share in the handset business. Among the elite group of the 5 largest manufacturers, Samsung and LG were the big winners as their long-term investments in enhancing their high-end product portfolios and improving their user interfaces started to pay major dividends.

Market share in the handset industry Q1 2006 – Q1 2008. Click image for larger version…
Compared to Q407, Samsung’s share rose by 1.9 percentage points to 15.7% on shipments of 46.3m, while LG was up by 1.2 points to 8.3% on shipments of 24.4m. This allowed LG to overtake Sony Ericsson as the world’s 4th largest manufacturer.
There was also a surge in shipments from manufacturers outside the top 5, which gained 1.9 percentage points of market share to 20%, with the number of handsets sold by smaller vendors rising to 59.1m.
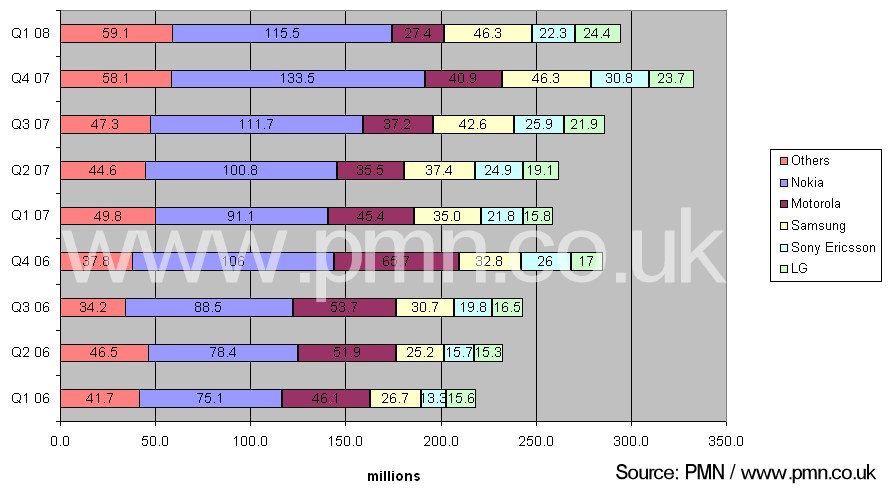
Unit shipments in the handset industry Q1 2006 – Q1 2008. Click image for larger version…
Q108 represented a new low for Motorola, where unit shipments fell by 33% from the previous quarter to 27.4m and market share contracted by 2.9 percentage points to 9.3%. The relative weakness in its average selling price (ASP) and the continued decline of the dollar against other international currencies mean that Motorola is now ranked 5th in terms of revenues from its handset business. This contrasts with 2nd in the same period a year ago.
Nokia also saw its market share fall slightly on a sequential basis, declining from 40.1% to 39.2% on shipments of 115.5m handsets.
The most significant contrasts between the 5 major manufacturers can be observed in their profit margins. Both Samsung and LG were extremely successful in improving their profitability. Samsung achieved a 14.1% margin, up from 10.8% in Q407, while LG hit 13.9%, up from 8.7% in the previous quarter. Sony Ericsson’s margins nearly halved from 13% to 7.1%, while Nokia’s declined from 23.8% to 20.3%. Motorola saw a further slide into the red, recording negative margins of -12.7%, compared to -8.1% in the previous quarter.

Profit margins in the handset industry Q1 2006 – Q1 2008. Click image for larger version…
We attribute Samsung and LG’s improving margins to their growing ability to charge premium prices for handsets on the basis of major improvements in industrial design, user interface, application functionality and marketing. Put simply, both Samsung and LG are reaping the rewards of their commitment to improving user experience, particularly in markets such as Europe and the US where their products were previously ill-suited to customer tastes.
This has been particularly apparent for LG, which has managed to reverse the earlier perceptions of it as a supplier of low-end, poorly performing 3G handsets to European operators who were desperate for devices in the early days of the 3G network rollout. Today, LG is perceived as a premium brand, with a diverse portfolio of advanced touchscreen, imaging and fashion products. The improvement in its margins reflect this, with profitability rising steadily from negative territory just over 2 years ago in Q1 2006 to a level well above the industry average.

Average selling price (ASP) in the handset industry Q1 2006 – Q1 2008. Click image for larger version…
However, the strong relative performances of the South Korean manufacturers may be challenged later in 2008 as Nokia prepares to introduce its most significant user interface changes for several years, including the introduction of touchscreen products. The significance of Nokia’s huge existing customer base, and its ability to outspend its competitors on R&D, marketing and in the new category of web service development, should not be underestimated. Nokia’s profits of over USD 3 billion in Q408 are nearly two and half times greater than the combined profits of the other 4 major manufacturers put together.
The issue of correlating user experience investment with measureable improvements in revenues, margins and average selling price (ASP) will be a key part of the discussion at our 4th annual PMN Mobile User Experience (MEX) conference in London next month (27th – 28th May). We encourage you to register for the event and join 100 of the most creative minds in telecoms for 2 days of learning, debate and relaxed networking – including many of the major handset manufacturers and network operators.
The event is based around our 10 point MEX Manifesto. Each of the Manifesto statements is backed up by a selection of ‘Stat Spots’ and research notes, to aid our speakers, panellists and breakout groups as we lead them through the in-depth agenda. We’ll also be sharing more metrics from PMN’s detailed model for tracking handset industry performance.
Register for the MEX event today to guarantee your place (all of our previous conferences sold out a couple of weeks in advance, so please book early to avoid disappointment). Delegate places are priced at GBP 1499 (+ VAT @ 17.5% where applicable).
+ There are no comments
Add yours